The problem
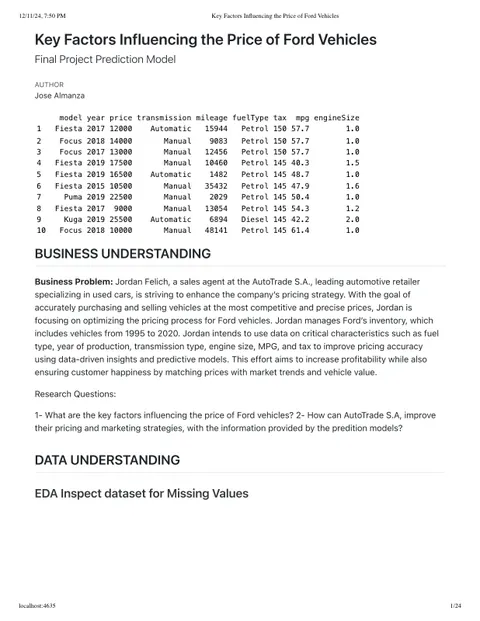
Jordan Felich, a sales agent at AutoTrade S.A. (a fictional used-car retailer), manages a Ford inventory spanning model years 1995–2020. He wants to buy and sell at competitive, accurate prices. The research asked which factors most influence Ford prices, and how well a model can predict price from a vehicle's characteristics.
Dataset & context
17,966 Ford vehicle records with model (Fiesta, Focus, Kuga, Puma and others), year, price, transmission, mileage, fuel type, tax, MPG, and engine size. The average vehicle was a 2017 model priced at about $12,280 with about 23,400 miles.
Methodology
- Explored relationships between price and each variable, and checked multicollinearity (GVIF).
- Model 1: full linear regression.
- Model 2: added interaction effects (year × mileage, mileage × fuel type).
- Model 3: interactions plus a quadratic term for year.
- Model 4: a regression tree, grown and pruned to its optimal size.
- Compared all four on hold-out RMSE and MAPE.
Tools
- R
- lm (linear models)
- rpart (regression trees)
- caret
- ggplot2
Key analysis
Adding interactions and a curved effect for model year steadily cut prediction error. The regression tree was the least accurate.
Findings
- Model year: each additional year added about $1,183.50.
- Mileage: about $0.06 of value lost per mile.
- Engine size: each additional liter added about $3,597.56.
- Automatics priced above manuals and semi-automatics. Hybrids and electrics started at a premium but lost value faster as mileage rose.
- The regression tree confirmed model year as the top predictor, followed by engine size and mileage.
Business implication
A dealership can use these drivers to price with confidence instead of instinct. That means a dynamic pricing system, better-targeted marketing, and smarter inventory decisions. Hybrids need their own pricing strategy because their value drops faster with mileage.
Final result
Model 3 (interactions plus a quadratic year term) explained 85.6% of price variability with the lowest error: RMSE $1,855 and MAPE 12.69%.
What I learned: data quality and model choice drive accuracy. Interaction effects and non-linear terms made a real difference, and market trends belong in any pricing strategy.